Posts

Showing posts with the label omega-6 to omega-3 ratio

Could we have evolved traits that are detrimental to our survival?

Image
Let us assume that we collected data on the presence or absence of a trait (e.g., propensity toward risky behavior) in a population of individuals, as well as on intermediate effects of the trait, downstream effects on mating and survival success, and ultimately on reproductive success (a.k.a. “fitness”, in evolutionary biology). The data would have been collected over several generations. Let us also assume that we conducted a multivariate analysis on this data, of the same type as the analyses employing WarpPLS that were discussed here in previous posts ( ). The results are summarized through the graph below. Each of the numbers next to the arrows in the graph below represents the strength of a cause-effect relationship. The number .244 linking “a” and “y” means that a one standard deviation variation in “a” causes a .244 standard deviation increase in “y”. It also means that a one standard deviation variation in “a” causes a 24.4 percent increase in “y” considering the average “y”...
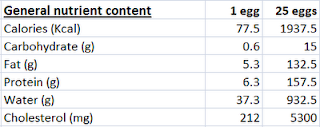
The man who ate 25 eggs per day: What does this case really tell us?

Image
Many readers of this blog have probably heard about the case of the man who ate approximately 25 eggs (20 to 30) per day for over 15 years (probably well over), was almost 90 years old (88) when the case was published in the prestigious The New England Journal of Medicine , and was in surprisingly good health ( ). The case was authored by the late Dr. Fred Kern, Jr., a widely published lipid researcher after whom the Kern Lipid Conference is named ( ). One of Kern’s research interests was bile, a bitter-tasting fluid produced by the liver (and stored in the gallbladder) that helps with the digestion of lipids in the small intestine. He frames the man’s case in terms of a compensatory adaptation tied to bile secretion, arguing that this man was rather unique in his ability to deal with a lethal daily dose of dietary cholesterol. Kern seemed to believe that dietary cholesterol was harmful, but that this man was somehow “immune” to it. This is ironic, because often this case is presented...

Nonlinearity and the industrial seed oils paradox

Image
Most relationships among variables in nature are nonlinear, frequently taking the form of a J curve. The figure below illustrates this type of curve. In this illustration, the horizontal axis measures the amount of time an individual spends consuming a given dose (high) of a substance daily. The vertical axis measures a certain disease marker – e.g., a marker of systemic inflammation, such as levels of circulating tumor necrosis factor (TNF). This is just one of many measurement schemes that may lead to a J curve. J-curve relationships and variants such as U-curve and inverted J-curve relationships  are ubiquitous , and may occur due to many reasons. For example, a J curve like the one above may be due to the substance being consumed having at least one health-promoting attribute, and at least one health-impairing attribute. The latter has a delayed effect, and ends up overcoming the benefits of the former over time. In this sense, there is no “sweet spot”. People are better off no...

38 g of sardines or 2 fish oil softgels? Let us look at the numbers

Image
The bar chart below shows the fat content of 1 sardine (38 g) canned in tomato sauce, and 2 fish oil softgels of the Nature Made brand. (The sardine is about 1/3 of the content of a typical can, and the data is from Nutritiondata.com. The two softgels are listed as the “serving size” on the Nature Made bottle.) Both the sardine and softgels have some vegetable oil added; presumably to increase their vitamin E content and form a more stable oil mix. This chart is a good reminder that looking at actual numbers can be quite instructive sometimes. Even though the chart focuses on fat content, it is worth noting that the 38 g sardine also contains 8 g of high quality protein. If your goal with the fish oil is to “neutralize” the omega-6 fat content of your diet, which is most people’s main goal, you should consider this. A rough measure of the omega-6 neutralization “power” of a food portion is, by definition, its omega-3 minus omega-6 content. For the 1 canned sardine, this difference is 5...

Nuts by numbers: Should you eat them, and how much?

Image
Nuts are generally seen as good sources of protein and magnesium. The latter plays a number of roles in the human body, and is considered critical for bone health. Nuts are also believed to be good sources of vitamin E. While there is a lot of debate about vitamin E’s role in health, it is considered by many to be a powerful antioxidant. Other than in nuts, vitamin E is not easily found in foods other than seeds and seed oils. Some of the foods that we call nuts are actually seeds; others are legumes. For simplification, in this post I am calling nuts those foods that are generally protected by shells (some harder than others). This protective layer is what makes most people call them nuts. Let us see how different nuts stack up against each other in terms of key nutrients. The quantities listed below are per 1 oz (28 g), and are based on data from Nutritiondata.com. All are raw. Roasting tends to reduce the vitamin content of nuts, often by half, and has little effect on the mineral c...

Low omega-6 to omega-3 ratio: Grain-fed meats or industrial vegetable oils?

Image
Just a little note on the use of language. Clearly there is no such a thing as grain-fed or grass-fed beef, because one does not feed beef anything. One feeds cattle grain or grass, and then the resulting beef is said to be “grain-fed” or “grass-fed”. It is a manner of speaking that facilitates discourse, which is why it is used here. To compensate for this digression, let me show you a graph, which pretty much summarizes the "punch line" of this post. The graph below shows the omega-6 fat contents of 1 lb (454 g) of grain-fed beef and 1 tablespoon (roughly 14 g) of a typical industrial vegetable oil (safflower oil). As you can see, there is a lot more omega-6 in the much smaller amount of industrial vegetable oil. A gram-for-gram comparison would practically make the beef content bar disappear. It has been estimated that our Paleolithic ancestors consumed a diet with an omega-6 to omega-3 ratio of about 1 . While other estimates exist, the general consensus seems to be that ...