Posts

Showing posts with the label HCE

The 2012 red meat-mortality study (Arch Intern Med): The data suggests that red meat is protective

Image
I am not a big fan of using arguments such as “food questionnaires are unreliable” and “observational studies are worthless” to completely dismiss a study. There are many reasons for this. One of them is that, when people misreport certain diet and lifestyle patterns, but do that consistently (i.e., everybody underreports food intake), the biasing effect on coefficients of association is minor. Measurement errors may remain for this or other reasons, but regression methods (linear and nonlinear) assume the existence of such errors, and are designed to yield robust coefficients in their presence. Besides, for me to use these types of arguments would be hypocritical, since I myself have done several analyses on the China Study data ( ), and built what I think are valid arguments based on those analyses. My approach is: Let us look at the data, any data, carefully, using appropriate analysis tools, and see what it tells us; maybe we will find evidence of measurement errors distorting the ...

Gaining muscle and losing fat at the same time: If I can do it, anyone can

Image
The idea of gaining muscle and losing fat at the same time seems impossible because of three widely held misconceptions: (a) to gain muscle you need a calorie surplus; (b) to lose fat you need a calorie deficit; and (c) you cannot achieve a calorie surplus and deficit at the same time. Not too long ago, unfortunately I was in the right position to do some self-experiments in order to try to gain muscle and concurrently lose fat, without steroids, keeping my weight essentially constant (within a range of a few lbs). This was because I was obese, and then reached a point in the fat loss stage where I could stop losing weight while attempting to lose fat. This is indeed difficult and slow, as muscle gain itself is slow, and it apparently becomes slower as one tries to restrict fat gain. Compounding that is the fact that self-experimentation invariably leads to some mistakes. The photos below show how I looked toward the end of my transformation from obese to relatively lean (righ...

HCE user experience: The anabolic range may be better measured in seconds than repetitions

Image
It is not uncommon for those who do weight training to see no gains over long periods of time for certain weight training exercises (e.g., overhead press), even while they experience gains in other types of exercise (e.g., regular squats). HealthCorrelator for Excel (HCE) and its main outputs, coefficients of association and graphs ( ), have been helping some creative users identify the reasons why they see no gains, and break out of the stagnation periods. It may be a good idea to measure the number of seconds of effort per set; in addition to other variables such as numbers of sets and repetitions, and the amount of weight lifted. In some cases, an inverted J curve, full or partial (just the left side of it), shows up suggesting that the number of seconds of effort in a particular type of weight training exercise is a better predictor of muscle gain than the number of repetitions used. The inverted J curve is similar to the one discussed in a previous post on HCE used for weight trai...

Finding your sweet spot for muscle gain with HCE

Image
In order to achieve muscle gain, one has to repeatedly hit the “supercompensation” window, which is a fleeting period of time occurring at some point in the muscle recovery phase after an intense anaerobic exercise session. The figure below, from Vladimir Zatsiorsky’s and William Kraemer’s outstanding book Science and Practice of Strength Training ( ) provides an illustration of the supercompensation idea. Supercompensation is covered in more detail in a previous post ( ). Trying to hit the supercompensation window is a common denominator among HealthCorrelator for Excel (HCE) users who employ the software ( ) to maximize muscle gain. (That is, among those who know and subscribe to the theory of supercompensation.) This post outlines what I believe is a good way of doing that while avoiding some pitfalls. The data used in the example that follows has been created by me, and is based on a real case. I disguised the data, simplified it, added error etc. to make the underlying method rel...

Triglycerides, VLDL, and industrial carbohydrate-rich foods

Image
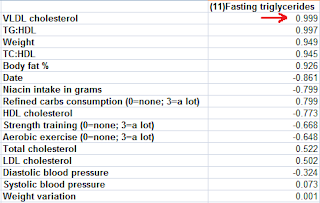
Below are the coefficients of association calculated by HealthCorrelator for Excel (HCE) for user John Doe. The coefficients of association are calculated as linear correlations in HCE ( ). The focus here is on the associations between fasting triglycerides and various other variables. Take a look at the coefficient of association at the top, with VLDL cholesterol, indicated with a red arrow. It is a very high 0.999. Whoa! What is this – 0.999! Is John Doe a unique case? No, this strong association between fasting triglycerides and VLDL cholesterol is a very common pattern among HCE users. The reason is simple. VLDL cholesterol is not normally measured directly, but typically calculated based on fasting triglycerides, by dividing the fasting triglycerides measurement by 5. And there is an underlying reason for that - fasting triglycerides and VLDL cholesterol are actually very highly correlated, based on direct measurements of these two variables. But if VLDL cholesterol is calcula...

Calling self-experimentation N=1 is incorrect and misleading

Image
This is not a post about semantics. Using “N=1” to refer to self-experimentation is okay, as long as one understands that self-experimentation is one of the most powerful ways to improve one’s health. Typically the term “N=1” is used in a demeaning way, as in: “It is just my N=1 experience, so it’s not worth much, but …” This is the reason behind this post. Using the “N=1” term to refer to self-experimentation in this way is both incorrect and misleading. Calling self-experimentation N=1 is incorrect The table below shows a dataset that is discussed in this YouTube video  on HealthCorrelator for Excel (HCE) . It refers to one single individual. Nearly all health-related datasets will look somewhat like this, with columns referring to health variables and rows referring to multiple measurements for the health variables. (This actually applies to datasets in general, including datasets about non-health-related phenomena.) Often each individual measurement, or row, will be associated ...

Health markers varying inexplicably? Do some detective work with HCE

Image
John was overweight, out of shape, and experiencing fatigue. What did he do? He removed foods rich in refined carbohydrates and sugars from his diet. He also ditched industrial seed oils and started exercising. He used HealthCorrelator for Excel (HCE)  to keep track of several health-related numbers over time (see figure below). Over the period of time covered in the dataset, health markers steadily improved. For example, John’s HDL cholesterol went from a little under 40 mg/dl to just under 70; see chart below, one of many generated by HCE. However, John’s blood pressure varied strangely during that time, as you can see on the chart below showing the variation of systolic blood pressure (SBP) against time. What could have been the reason for that? Salt intake is an unlikely culprit, as we’ve seen before . As it turns out, John knew that heart rate could influence blood pressure somewhat, and he also knew that his doctor’s office measured his heart rate regularly. So he got the dat...

The China Study II: A look at mortality in the 35-69 and 70-79 age ranges

Image
This post is based on an analysis of a subset of the China Study II data, using HealthCorrelator for Excel (HCE) , which is publicly available for download and use on a free trial basis. You can access the original data on the HCE web site, under “Sample datasets”. HCE was designed to be used with small and individual personal datasets, but it can also be used with larger datasets for multiple individuals. This analysis focuses on two main variables from the China Study II data: mortality in the 35-69 age range, and mortality in the 70-79 range. The table below shows the coefficients of association calculated by HCE for those two variables. The original variable labels are shown. One advantage of looking at mortality in these ranges is that they are more likely to reflect the impact of degenerative diseases. Infectious diseases likely killed a lot of children in China at the time the data was being collected. Heart disease, on the other hand, is likely to have killed more people in the...

HealthCorrelator for Excel (HCE) is now publicly available for free trial

HealthCorrelator for Excel (HCE)  is now publicly available for download and use on a free trial basis. For those users who decide to buy it after trying, licenses are available for individuals and organizations. If you are a gym member, consider asking your gym to buy an organizational site license; this would allow the gym to distribute individual licenses at no cost to you and your colleagues. HCE is a user-friendly Excel-based software that unveils important associations among health variables at the click of a button. Here are some of its main features: - Easy to use yet powerful health management software. - Estimates associations among any number of health variables. - Automatically orders associations by decreasing absolute strength. - Graphs relationships between pairs of health variables, for all possible combinations. The beta testing was successfully completed, with fairly positive results. (Thank you beta testers!) Among beta testers were Mac users. The main request fr...

HealthCorrelator for Excel 1.0 (HCE): Call for beta testers

This call is closed. Beta testing has been successfully completed. HealthCorrelator for Excel (HCE) is now publicly available for download and use on a free trial basis. For those users who decide to buy it after trying, licenses are available for individuals and organizations. To download a free trial version – as well as get the User Manual, view demo YouTube videos, and download and try sample datasets – visit the HealthCorrelator.com web site.

Human traits are distributed along bell curves: You need to know yourself, and HCE can help

Image
Most human traits (e.g., body fat percentage, blood pressure, propensity toward depression) are influenced by our genes; some more than others. The vast majority of traits are also influenced by environmental factors, the “nurture” part of the “nature-nurture” equation. Very few traits are “innate”, such as blood type. This means that manipulating environmental factors, such as diet and lifestyle, can strongly influence how the traits are finally expressed in humans. But each individual tends to respond differently to diet and lifestyle changes, because each individual is unique in terms of his or her combination of “nature” and “nurture”. Even identical twins are different in that respect. When plotted, traits that are influenced by our genes are distributed along a bell-shaped curve. For example, a trait like body fat percentage, when measured in a population of 1000 individuals, will yield a distribution of values that will look like a bell-shaped distribution. This type of distribu...