Posts

Showing posts with the label longevity

The War of the End of the World: The health puzzle posed by its survivors

Image
The War of Canudos took place in Brazil in 1896 and 1897. Canudos was a settlement of several thousand deeply religious Christians, led by a man known as Antonio Conselheiro. They opposed the recent establishment of the Republic of Brazil, particularly the institution of income taxes and civil marriage; the former was considered government-sponsored theft and the latter a sacrilege. The republic had been declared in 1889 following a military coup that deposed Dom Pedro II, an emperor beloved by the common people and under whose rule slavery had recently been abolished. Canudos was located in the Brazilian sertão , an inhospitable semi-arid region in the northeastern part of the country. The inhabitants of Canudos were the sertanejos . The term jagunço was used to refer to the males, especially the outlaws. Many of the sertanejos lived in semi-starvation, in poor sanitary conditions, and with very limited (if any) access to healthcare. Infant mortality was very high at the time. Thos...
The man who ate 25 eggs per day: What does this case really tell us?

Image
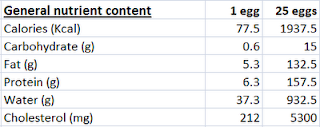
Many readers of this blog have probably heard about the case of the man who ate approximately 25 eggs (20 to 30) per day for over 15 years (probably well over), was almost 90 years old (88) when the case was published in the prestigious The New England Journal of Medicine , and was in surprisingly good health ( ). The case was authored by the late Dr. Fred Kern, Jr., a widely published lipid researcher after whom the Kern Lipid Conference is named ( ). One of Kern’s research interests was bile, a bitter-tasting fluid produced by the liver (and stored in the gallbladder) that helps with the digestion of lipids in the small intestine. He frames the man’s case in terms of a compensatory adaptation tied to bile secretion, arguing that this man was rather unique in his ability to deal with a lethal daily dose of dietary cholesterol. Kern seemed to believe that dietary cholesterol was harmful, but that this man was somehow “immune” to it. This is ironic, because often this case is presented...

The lowest-mortality BMI: What is the role of nutrient intake from food?

Image
In a previous post ( ), I discussed the frequently reported lowest-mortality body mass index (BMI), which is about 26. The empirical results reviewed in that post suggest that fat-free mass plays an important role in that context. Keep in mind that this "BMI=26 phenomenon" is often reported in studies of populations from developed countries, which are likely to be relatively sedentary. This is important for the point made in this post. A lowest-mortality BMI of 26 is somehow at odds with the fact that many healthy and/or long-living populations have much lower BMIs. You can clearly see this in the distribution of BMIs among males in Kitava and Sweden shown in the graph below, from a study by Lindeberg and colleagues ( ). This distribution is shifted in such a way that would suggest a much lower BMI of lowest-mortality among the Kitavans, assuming a U-curve shape similar to that observed in studies of populations from developed countries ( ). Another relevant example come...

The lowest-mortality BMI: What is its relationship with fat-free mass?

Image
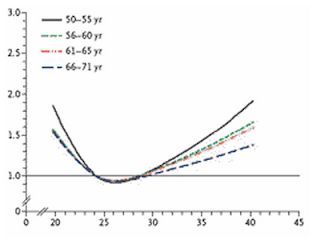
Do overweight folks live longer? It is not uncommon to see graphs like the one below, from the Med Journal Watch blog ( ), suggesting that, at least as far as body mass index (BMI) is concerned ( ), overweight folks (25 < BMI < 30) seem to live longer. The graph shows BMI measured at a certain age, and risk of death within a certain time period (e.g., 20 years) following the measurement. The lowest-mortality BMI is about 26, which is in the overweight area of the BMI chart. Note that relative age-adjusted mortality risk (i.e., relative to the mortality risk of people in the same age group), increases less steeply in response to weight variations as one becomes older. An older person increases the risk of dying to a lesser extent by weighing more or less than does a younger person. This seems to be particularly true for weight gain (as opposed to weight loss). The table below is from a widely cited 2002 article by Allison and colleagues ( ), where they describe a study of 10,169 ...

The 2012 Arch Intern Med red meat-mortality study: Eating 234 g/d of red meat could reduce mortality by 23 percent

Image
As we have seen in an earlier post on the China Study data ( ), which explored relationships hinted at by Denise Minger’s previous and highly perceptive analysis ( ), one can use a multivariate analysis tool like WarpPLS ( ) to explore relationships based on data reported by others. This is true even when the dataset available is fairly small. So I entered the data reported in the most recent (published online in March 2012) study looking at the relationship between red meat consumption and mortality into WarpPLS to do some exploratory analyses. I discussed the study in my previous post; it was conducted by Pan et al. (Frank B. Hu is the senior author) and published in the prestigious Archives of Internal Medicine ( ). The data I used is from Table 1 of the article; it reports figures on several variables along 5 quintiles, based on separate analyses of two samples, called “Health Professionals” and “Nurses Health” samples. The Health Professionals sample comprised males; the Nurses H...

The 2012 red meat-mortality study (Arch Intern Med): The data suggests that red meat is protective

Image
I am not a big fan of using arguments such as “food questionnaires are unreliable” and “observational studies are worthless” to completely dismiss a study. There are many reasons for this. One of them is that, when people misreport certain diet and lifestyle patterns, but do that consistently (i.e., everybody underreports food intake), the biasing effect on coefficients of association is minor. Measurement errors may remain for this or other reasons, but regression methods (linear and nonlinear) assume the existence of such errors, and are designed to yield robust coefficients in their presence. Besides, for me to use these types of arguments would be hypocritical, since I myself have done several analyses on the China Study data ( ), and built what I think are valid arguments based on those analyses. My approach is: Let us look at the data, any data, carefully, using appropriate analysis tools, and see what it tells us; maybe we will find evidence of measurement errors distorting the ...

The “pork paradox”? National pork consumption and obesity

Image
In my previous post ( ) I discussed some country data linking pork consumption and health, analyzed with WarpPLS ( ). One of the datasets used, the most complete, contained data from Nationmaster.com ( ) for the following countries: Australia, Brazil, Canada, China, Denmark, France, Germany, Hong Kong, Hungary, Japan, Mexico, Poland, Russia, Singapore, Spain, Sweden, United Kingdom, and United States. That previous post also addressed a study by Bridges ( ), based on country-level data, suggesting that pork consumption may cause liver disease. In this post we continue that analysis, but with a much more complex model containing the following country variables: wealth (PPP-adjusted GNP/person), pork consumption (lbs/person/year), alcohol consumption (liters/person/year), obesity (% of population), and life expectancy (years). The model and results, generated by WarpPLS, are shown on the figure below. (See notes at the end of this post.) These results are only for direct effects. War...

Does pork consumption cause cirrhosis? Perhaps, if people become obese from eating pork

Image
The idea that pork consumption may cause cirrhosis has been around for a while. A fairly widely cited 1985 study by Nanji and French ( ) provides one of the strongest indictments of pork: “In countries with low alcohol consumption, no correlation was obtained between alcohol consumption and cirrhosis. However, a significant correlation was obtained between cirrhosis and pork.” Recently Paul Jaminet wrote a blog post on the possible link between pork consumption and cirrhosis ( ). Paul should be commended for bringing this topic to the fore, as the implications are far-reaching and very serious. One of the key studies mentioned in Paul’s post is a 2009 article by Bridges ( ), from which the graphs below were taken. The graphs above show a correlation between cirrhosis and alcohol consumption of 0.71, and a correlation between cirrhosis and pork consumption of 0.83. That is, the correlation between cirrhosis and pork consumption is the stronger of the two! Combining this with the Nanji a...

The China Study II: How gender takes us to the elusive and deadly factor X

Image
The graph below shows the mortality in the 35-69 and 70-79 age ranges for men and women for the China Study II dataset. I discussed other results in my two previous posts ( ) ( ), all taking us to this post. The full data for the China Study II study is publicly available ( ). The mortality numbers are actually averages of male and female deaths by 1,000 people in each of several counties, in each of the two age ranges. Men do tend to die earlier than women, but the difference above is too large. Generally speaking, when you look at a set time period that is long enough for a good number of deaths (not to be confused with “a number of good deaths”) to be observed, you tend to see around 5-10 percent more deaths among men than among women. This is when other variables are controlled for, or when men and women do not adopt dramatically different diets and lifestyles. One of many examples is a study in Finland ( ); you have to go beyond the abstract on this one. As you can see from the gr...