Posts

Showing posts with the label body fat

Waist-to-weight ratios in pictures: The John Stone transformation

Image
John Stone is a bodybuilder and founder of a bodybuilding and fitness web site ( ). There he has provided pictures and stats of his remarkable transformation, which were used to prepare the montage below. John’s height is reported as 5' 11.5". Below the photos are the months in which they were taken, the waist circumferences in inches, the weights in lbs, and the waist-to-weight ratios (WWRs). Abhi was kind enough to provide a more detailed plot of John Stone’s WWRs ( ). Assuming that minimizing one’s WWR is healthy, an idea whose rationale was explained here before ( ), we could say that John was at his most unhealthy in the photo on the left. The second photo from the left shows a slightly more healthy state, at a reported 8 percent body fat (his lowest). The two photos on the right represent states in which John’s WWR is at its lowest, namely 0.1544. That is, in these two photos John minimized his WWR; at a reported 14 and 13.8 percent body fat, respectively. When w...
Could grain-fed beef liver be particularly nutritious?

Image
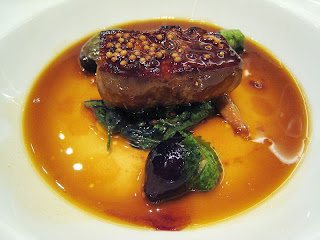
There is a pervasive belief today that grain-fed beef is unhealthy, a belief that I addressed before in this blog ( ) and that I think is exaggerated. This general belief seems to also apply to a related meat, one that is widely acknowledged as a major micronutrient “powerhouse”, namely grain-fed beef liver. Regarding grain-fed beef liver, the idea is that cattle that are grain-fed tend to develop a mild form of fatty liver disease. This I am inclined to agree with. However, I am not convinced that this is such a bad thing for those who eat grain-fed beef liver. In most animals, including Homo sapiens , fatty liver disease seems to be associated with extra load being put on the liver. Possible reasons for this are accelerated growth, abnormally high levels of body fat, and ingestion of toxins beyond a certain hormetic threshold (e.g., alcohol). In these cases, what would one expect to see as a body response? The extra load is associated with high oxidative stress and rate of meta...

How can carrying some extra body fat be healthy?

Image
Most of the empirical investigations into the association between body mass index (BMI) and mortality suggest that the lowest-mortality BMI is approximately on the border between the normal and overweight ranges. Or, as Peter put it ( ): "Getting fat is good." As much as one may be tempted to explain this based only on the relative contribution of lean body mass to total weight, the evidence suggests that both body fat and lean body mass contribute to this phenomenon. In fact, the evidence suggests that carrying some extra body fat may be healthy for many. Yet, the scientific evidence strongly suggests that body fat accumulation beyond a certain point is unhealthy. There seems to be a sweet spot of body fat percentage, and that sweet spot may vary a lot across different individuals. One interesting aspect of most empirical investigations of the association between BMI and mortality is that the participants live in urban or semi-urban societies. When you look at hunter-ga...

An illustration of the waist-to-weight ratio theory: The fit2fat2fit experiment

Image
In my previous blog post, I argued that one’s optimal weight may be the one that minimizes one’s waist-to-weight ratio. I built this argument based on the fact that body fat percentage is associated with lean body mass (and also weight) in a nonlinear way. The fit2fat2fit experiment ( ), provides what seems to be an interestingly way to put this optimal waist-to-weight ratio theory to test. This is due to a fortuitous event, as I explain in this post. In this experiment, Drew Manning, a personal trainer, decided to undergo a transformation where he went from what he argued was his fittest level, all the way to obese, and then back to fit again. He said that he wanted to do that so that he could better understand his clients’ struggles. This may be true, but it looks like he planned very well his experiment from a marketing perspective. His fittest level was at the start, with a weight of 193 lbs, at a height of 6 ft 2 in. That was his fittest level according to his own opinion. At...

What is your optimal weight? Maybe it is the one that minimizes your waist-to-weight ratio

There is a significant amount of empirical evidence suggesting that, for a given individual and under normal circumstances, the optimal weight is the one that maximizes the ratio below, where: L = lean body mass, and T = total mass. L / T L is difficult and often costly to measure. T can be measured easily, as one’s total weight. Through some simple algebraic manipulations, you can see below that the ratio above can be rewritten in terms of one’s body fat mass (F). L / T = (T – F) / T = 1 – F / T Therefore, in order to maximize L / T, one should maximize 1 – F / T. This essentially means that one should minimize the second term, or the ratio below, which is one’s body fat mass (F) divided by one’s weight (T). F / T So, you may say, all I have to do is to minimize my body fat percentage. The problem with this is that body fat percentage is very difficult to measure with precision, and, perhaps more importantly, body fat percentage is associated with lean body mass (and also wei...

Drs. Francisco Cervantes and Marivic Torregosa, and the 2013 Ancestral Health Symposium

Image
Last year I traveled to South Korea to give presentations on nonlinear structural equation modeling and WarpPLS ( ). These are an advanced statistical analysis technique and related software tool, respectively, which have been used extensively in this blog to analyze health data, notably data related to the China Study. I gave a couple of presentations at Korea University, which is in Seoul, and a keynote address at a conference in Gwangju, in the south part of the country. So I ended up seeing quite a lot of this beautiful country, and meeting many people. Some of my impressions regarding health and lifestyle issues need separate blog posts, which are forthcoming. One issue that kept me thinking, as it did when I visited Japan a few years ago as well, was the obvious leanness of the South Koreans, compared with Americans, even though you don’t see a lot of emphasis on dieting there. Interestingly, this phenomenon also poses a challenge to many dietary schools of thought. For examp...

No fat gain while eating well during the Holiday Season: Palatability isolines, the 14-percent advantage, and nature’s special spice

Image
Like most animals, our Paleolithic ancestors had to regularly undergo short periods of low calorie intake. If they were successful at procuring food, those ancestors alternated between periods of mild famine and feast. As a result, nature allowed them to survive and leave offspring. The periods of feast likely involved higher-than-average consumption of animal foods, with the opposite probably being true in periods of mild famine. Almost anyone who adopted a low carbohydrate diet for a while will tell you that they find foods previously perceived as bland, such as carrots or walnuts, to taste very sweet – meaning, to taste very good. This is a special case of a more general phenomenon. If a nutrient is important for your body, and your body is deficient in it, those foods that contain the nutrient will taste very good. This rule of thumb applies primarily to foods that contributed to selection pressures in our evolutionary past. Mostly these were foods available in our Paleolithic ev...

The steep obesity increase in the USA in the 1980s: In a sense, it reflects a major success story

Image
Obesity rates have increased in the USA over the years, but the steep increase starting around the 1980s is unusual. Wang and Beydoun do a good job at discussing this puzzling phenomenon ( ), and a blog post by Discover Magazine provides a graph (see below) that clear illustrates it ( ). What is the reason for this? You may be tempted to point at increases in calorie intake and/or changes in macronutrient composition, but neither can explain this sharp increase in obesity in the 1980s. The differences in calorie intake and macronutrient composition are simply not large enough to fully account for such a steep increase. And the data is actually full of oddities. For example, an article by Austin and colleagues (which ironically blames calorie consumption for the obesity epidemic) suggests that obese men in a NHANES (2005–2006) sample consumed only 2.2 percent more calories per day on average than normal weight men in a NHANES I (1971–1975) sample ( ). So, what could be the main reason ...

The 14-percent advantage of eating little and then a lot: Putting it in practice

Image
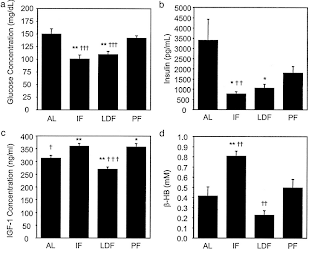
In my previous post I argued that the human body may react to “eating big” as it would to overfeeding, increasing energy expenditure by a certain amount. That increase seems to lead to a reduction in the caloric value of the meals during overfeeding; a reduction that seems to gravitate around 14 percent of the overfed amount. And what is the overfed amount? Let us assume that your daily calorie intake to maintain your current body weight is 2,000 calories. However, one day you consume 1,000 calories, and the next 3,000 – adding up to 4,000 calories in 2 days. This amounts to 2,000 calories per day on average, the weight maintenance amount; but the extra 1,000 on the second day is perceived by your body as overfeeding. So 140 calories are “lost” . The mechanisms by which this could happen are not entirely clear. Some studies contain clues; one example is the 2002 study conducted with mice by Anson and colleagues ( ), from which the graphs below were taken. In the graphs above AL refers ...

The 14-percent advantage of eating little and then a lot: Is it real?

Image
When you look at the literature on overfeeding, you see a number over and over again – 14 percent. That is approximately the increase in energy expenditure you get when you overfeed people; that is, when you feed people more calories that they need to maintain their current weight. This phenomenon is related to another interesting one: the nonlinear increase in body weight and fat mass following overfeeding after a period starvation, illustrated by the top graph below from an article by Kevin Hall ( ). The data for the squares on the top graph is from the Minnesota Starvation Experiment ( ). The graph at the bottom is based mostly on the results of a simulation, and doesn’t clearly reflect the phenomenon. Due to the significant amount of weight lost in what is called above the semistarvation stage (SS), the controlled refeeding period (CR) actually involved significant overfeeding. Nevertheless, weight was not gained right away, due to a sharp increase in energy expenditure. That is...

The lowest-mortality BMI: What is the role of nutrient intake from food?

Image
In a previous post ( ), I discussed the frequently reported lowest-mortality body mass index (BMI), which is about 26. The empirical results reviewed in that post suggest that fat-free mass plays an important role in that context. Keep in mind that this "BMI=26 phenomenon" is often reported in studies of populations from developed countries, which are likely to be relatively sedentary. This is important for the point made in this post. A lowest-mortality BMI of 26 is somehow at odds with the fact that many healthy and/or long-living populations have much lower BMIs. You can clearly see this in the distribution of BMIs among males in Kitava and Sweden shown in the graph below, from a study by Lindeberg and colleagues ( ). This distribution is shifted in such a way that would suggest a much lower BMI of lowest-mortality among the Kitavans, assuming a U-curve shape similar to that observed in studies of populations from developed countries ( ). Another relevant example come...

The lowest-mortality BMI: What is its relationship with fat-free mass?

Image
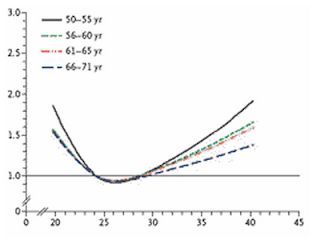
Do overweight folks live longer? It is not uncommon to see graphs like the one below, from the Med Journal Watch blog ( ), suggesting that, at least as far as body mass index (BMI) is concerned ( ), overweight folks (25 < BMI < 30) seem to live longer. The graph shows BMI measured at a certain age, and risk of death within a certain time period (e.g., 20 years) following the measurement. The lowest-mortality BMI is about 26, which is in the overweight area of the BMI chart. Note that relative age-adjusted mortality risk (i.e., relative to the mortality risk of people in the same age group), increases less steeply in response to weight variations as one becomes older. An older person increases the risk of dying to a lesser extent by weighing more or less than does a younger person. This seems to be particularly true for weight gain (as opposed to weight loss). The table below is from a widely cited 2002 article by Allison and colleagues ( ), where they describe a study of 10,169 ...

The 2012 Arch Intern Med red meat-mortality study: The “protective” effect of smoking

Image
In a previous post ( ) I used WarpPLS ( ) to analyze the model below, using data reported in a recent study looking at the relationship between red meat consumption and mortality. The model below shows the different paths through which smoking influences mortality, highlighted in red. The study was not about smoking, but data was collected on that variable; hence this post. When one builds a model like the one above, and tests it with empirical data, the person does something similar to what a physicist would do. The model is a graphical representation of a complex equation, which embodies the beliefs of the modeler. WarpPLS builds the complex equation automatically for the user, who would otherwise have to write it down using mathematical symbols. The results yielded by the complex equation, partly in the form of coefficients of association for direct relationships (the betas next to the arrows), have a meaning. Some may look odd, and require novel interpretations, much in the same...

Hunger is your best friend: It makes natural foods taste delicious and promotes optimal nutrient partitioning

Image
One of the biggest problems with modern diets rich in industrial foods is that they promote unnatural hunger patterns. For example, hunger can be caused by hypoglycemic dips, coupled with force-storage of fat in adipocytes, after meals rich in refined carbohydrates. This is a double-edged post-meal pattern that is induced by, among other things, abnormally elevated insulin levels. The resulting hunger is a rather unnatural type of hunger. By the way, I often read here and there, mostly in blogs, that “insulin suppresses hunger”. I frankly don’t know where this idea comes from. What actually happens is that insulin is co-secreted with a number of other hormones. One of those, like insulin also secreted by the beta-cells in the pancreas, is amylin – a powerful appetite suppressor. Amylin deficiency leads to hunger even after a large carbohydrate-rich meal, when insulin levels are elevated. Abnormally high insulin levels – like those after a “healthy” breakfast of carbohydrate-rich cere...

Gaining muscle and losing fat at the same time: A more customized approach based on strength training and calorie intake variation

Image
In the two last posts I discussed the idea of gaining muscle and losing fat at the same time ( ) ( ). This post outlines one approach to make that happen, based on my own experience and that of several HCE ( ) users. This approach may well be the most natural from an evolutionary perspective. But first let us address one important question: Why would anyone want to reach a certain body weight and keep it constant, resorting to the more difficult and slow strategy of “turning fat into muscle”, so to speak? One could simply keep on losing fat, without losing or gaining muscle, until he or she reaches a very low body fat percentage (e.g., a single-digit body fat percentage, for men). Then he or she could go up from there, slowly putting on muscle. The reason why it is advisable to reach a certain body weight and keep it constant is that, below a certain weight, one is likely to run into nutrient deficiencies . Non-exercise energy expenditure is proportional to body weight. As you keep on...

Gaining muscle and losing fat at the same time: Various issues and two key requirements

Image
In my previous post ( ), I mentioned that the idea of gaining muscle and losing fat at the same time seems impossible to most people because of three widely held misconceptions: (a) to gain muscle you need a calorie surplus; (b) to lose fat you need a calorie deficit; and (c) you cannot achieve a calorie surplus and deficit at the same time. The scenario used to illustrate what I see as a non-traumatic move from obese or seriously overweight to lean is one in which weight loss and fat loss go hand in hand until a relatively lean level is reached, beyond which weight is maintained constant (as illustrated in the schematic graph below). If you are departing from an obese or seriously overweight level, it may be advisable to lose weight until you reach a body fat level of around 21-24 percent for women or 14-17 percent for men. Once you reach that level, it may be best to stop losing weight, and instead slowly gain muscle and lose fat, in equal amounts. I will discuss the rationale for th...