Posts

Showing posts with the label diabetes

Drs. Francisco Cervantes and Marivic Torregosa, and the 2013 Ancestral Health Symposium

Image
Last year I traveled to South Korea to give presentations on nonlinear structural equation modeling and WarpPLS ( ). These are an advanced statistical analysis technique and related software tool, respectively, which have been used extensively in this blog to analyze health data, notably data related to the China Study. I gave a couple of presentations at Korea University, which is in Seoul, and a keynote address at a conference in Gwangju, in the south part of the country. So I ended up seeing quite a lot of this beautiful country, and meeting many people. Some of my impressions regarding health and lifestyle issues need separate blog posts, which are forthcoming. One issue that kept me thinking, as it did when I visited Japan a few years ago as well, was the obvious leanness of the South Koreans, compared with Americans, even though you don’t see a lot of emphasis on dieting there. Interestingly, this phenomenon also poses a challenge to many dietary schools of thought. For examp...

The 2013 PLoS ONE sugar and diabetes study: Sugar from fruits is harmless

Image
A new study linking sugar consumption with diabetes prevalence has gained significant media attention recently. The study was published in February 2013 in the journal PLoS ONE ( ). The authors are Sanjay Basu, Paula Yoffe, Nancy Hills and Robert H. Lustig. Among the claims made by the media is that “… sugar consumption — independent of obesity — is a major factor behind the recent global pandemic of type 2 diabetes” ( ). As it turns out, the effects revealed by the study seem to be very small, which may actually be a side effect of data aggregation; I will discuss this further below. Fruits are exonerated Let me start by saying that this study also included in the analysis the main natural source of sugar, fruit, as a competing variable (competing with the effects of sugar itself), and found it to be unrelated to diabetes. As the authors note: “None of the other food categories — including fiber-containing foods (pulses, nuts, vegetables, roots, tubers), fruits, meats, cereals, and ...

How much alcohol is optimal? Maybe less than you think

Image
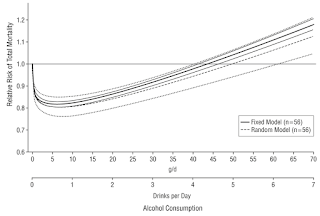
I have been regularly recommending to users of the software HCE ( ) to include a column in their health data reflecting their alcohol consumption. Why? Because I suspect that alcohol consumption is behind many of what we call the “diseases of affluence”. A while ago I recall watching an interview with a centenarian, a very lucid woman. When asked about her “secret” to live a long life, she said that she added a little bit of whiskey to her coffee every morning. It was something like a tablespoon of whiskey, or about 15 g, which amounted to approximately 6 g of ethanol every single day. Well, she might have been drinking very close to the optimal amount of alcohol per day for the average person, if the study reviewed in this post is correct. Studies of the effect of alcohol consumption on health generally show results in terms of averages within fixed ranges of consumption. For example, they will show average mortality risks for people consuming 1, 2, 3 etc. drinks per day. These studie...

Does tallness cause heart disease? No, but sex does

Image
Popular beliefs about medical issues are sometimes motivated by a statistical phenomenon known as “spurious relationship”, among other names. Two variables X and Y are influenced by a third variable C, which leads to X and Y being correlated and thus the impression that X and Y are causally associated. Take a look at the table below, which I blogged about in a previous post ( ). This table shows that there is a strong unadjusted correlation between height and arterial stiffness, a marker of heart disease. The likelihood that the correlation is due to chance is lower than one tenth of a percentage point (P Interestingly, the authors of the study even use height as a control variable to narrow down the “true” causes of arterial stiffness (column with adjusted results), assuming that height did indeed influence arterial stiffness and what they found to be a key predictor of arterial stiffness, 2-hour postprandial glucose. But there is no convincing evidence that height causes heart dis...

The 2012 Arch Intern Med red meat-mortality study: Eating 234 g/d of red meat could reduce mortality by 23 percent

Image
As we have seen in an earlier post on the China Study data ( ), which explored relationships hinted at by Denise Minger’s previous and highly perceptive analysis ( ), one can use a multivariate analysis tool like WarpPLS ( ) to explore relationships based on data reported by others. This is true even when the dataset available is fairly small. So I entered the data reported in the most recent (published online in March 2012) study looking at the relationship between red meat consumption and mortality into WarpPLS to do some exploratory analyses. I discussed the study in my previous post; it was conducted by Pan et al. (Frank B. Hu is the senior author) and published in the prestigious Archives of Internal Medicine ( ). The data I used is from Table 1 of the article; it reports figures on several variables along 5 quintiles, based on separate analyses of two samples, called “Health Professionals” and “Nurses Health” samples. The Health Professionals sample comprised males; the Nurses H...

The 2012 red meat-mortality study (Arch Intern Med): The data suggests that red meat is protective

Image
I am not a big fan of using arguments such as “food questionnaires are unreliable” and “observational studies are worthless” to completely dismiss a study. There are many reasons for this. One of them is that, when people misreport certain diet and lifestyle patterns, but do that consistently (i.e., everybody underreports food intake), the biasing effect on coefficients of association is minor. Measurement errors may remain for this or other reasons, but regression methods (linear and nonlinear) assume the existence of such errors, and are designed to yield robust coefficients in their presence. Besides, for me to use these types of arguments would be hypocritical, since I myself have done several analyses on the China Study data ( ), and built what I think are valid arguments based on those analyses. My approach is: Let us look at the data, any data, carefully, using appropriate analysis tools, and see what it tells us; maybe we will find evidence of measurement errors distorting the ...

Book review: Perfect Health Diet

Image
Perfect Health Diet is a book that one should own. It is not the type of book that you can get from your local library and just do a quick read over (and, maybe, write a review about it). If you do that, you will probably miss several important ideas that form the foundation of this book, which is a deep foundation. The book is titled “Perfect Health Diet”, not “The Perfect Health Diet”. If you think that this is a mistake, consider that the most successful social networking web site of all time started as “The Facebook”, and then changed to simply “Facebook”; which was perceived later as a major improvement. Moreover, “Perfect Health Diet” makes for a cool and not at all inappropriate acronym – “PHD”. What people eat has an enormous influence on their lives, and also on the lives of those around them. Nutrition is clearly one of the most important topics in the modern world - it is the source of much happiness and suffering for entire populations. If Albert Einstein and Marie Curie w...

Being glucose intolerant may make you live only to be 96, if you would otherwise live to be 100

Image
This comes also from the widely cited Brunner and colleagues study , published in Diabetes Care in 2006. They defined a person as glucose intolerant if he or she had a blood glucose level of 5.3-11 mmol/l after a 2-h post–50-g oral glucose tolerance test. For those using the other measurement system, like us here in the USA, that is a blood glucose level of approximately 95-198 mg/dl. Quite a range, eh!? This covers the high end of normoglycemia, as well as pre- to full-blown type 2 diabetes. In this investigation, called the Whitehall Study, 18,403 nonindustrial London-based male civil servants aged 40 to 64 years were examined between September 1967 and January 1970. These folks were then followed for over 30 years, based on the National Health Service Central Registry; essentially to find out whether they had died, and of what. During this period, there were 11,426 deaths from all causes; with 5,497 due to cardiovascular disease (48.1%) and 3,240 due to cancer (28.4%). The graph be...

Fasting blood glucose of 83 mg/dl and heart disease: Fact and fiction

Image
If you are interested in the connection between blood glucose control and heart disease, you have probably done your homework. This is a scary connection, and sometimes the information on the Internetz make people even more scared. You have probably seen something to this effect mentioned: Heart disease risk increases in a linear fashion as fasting blood glucose rises beyond 83 mg/dl . In fact, I have seen this many times, including on some very respectable blogs. I suspect it started with one blogger, and then got repeated over and over again by others; sometimes things become “true” through repetition. Frequently the reference cited is a study by Brunner and colleagues , published in Diabetes Care in 2006. I doubt very much the bloggers in question actually read this article. Sometimes a study by Coutinho and colleagues is also cited, but this latter study is actually a meta-analysis. So I decided to take a look at the Brunner and colleagues study. It covers, among other things, t...

Men who are skinny-fat: There are quite a few of them

Image
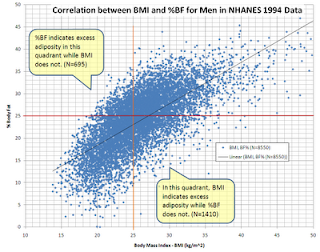
The graph below (from Wikipedia) plots body fat percentage (BF) against body mass index (BMI) for men. The data is a bit old: 1994. The top-left quadrant refers to men with BF greater than 25 percent and BMI lower than 25. A man with a BF greater than 25 has crossed into obese territory, even though a BMI lower than 25 would suggest that he is not even overweight. These folks are what we could call skinny-fat men. The data is from the National Health and Nutrition Examination Survey (NHANES), so it is from the USA only. Interesting that even though this data is from 1994, we already could find quite a few men with more than 25 percent BF and a BMI of around 20. One example of this would be a man who is 5’11’’, weighing 145 lbs, and who would be technically obese! About 8 percent of the entire sample of men used as a basis for the plot fell into the area defined by the top-left quadrant – the skinny-fat men. (That quadrant is one in which the BMI measure is quite deceiving; another is t...

Book review: Sugar Nation

Image
Jeff O’Connell is the Editor-in-Chief for Bodybuilding.com , a former executive writer for Men’s Health , and former Editor-in-Chief of Muscle & Fitness . He is also the author of a few bestselling books on fitness. (Source: Bodybuilding.com) It is obvious that Jeff is someone who can write, and this comes across very clearly in his new book, Sugar Nation . Now, with a title like this, Sugar Nation , I was expecting a book discussing trends of sugar consumption in the USA, and the related trends in various degenerative diseases. So when I started reading the book I was slightly put off by what seemed to be a book about a very personal journey, written in the first person by the author. Yet, after reading it for a while I was hooked, and literally could not put the book down. Jeff has managed to write something of a page-turner, combining a harrowing personal account with carefully researched scientific information, about a relatively rare form of type 2 diabetes. Jeff has a genetic...

Resveratrol Improves Insulin Sensitivity in Humans

Low-dose supplementation of resveratrol daily may reduce oxidative stress and improve the body's sensitivity to insulin, a study from University of Pecs in Hungary suggests. In a double-blind, placebo-controlled study published in the British Journal of Nutrition , Hungarian researchers report observations that people with type 2 diabetes who take 5 milligrams of resveratrol twice daily improved their sensitivity to insulin after only our weeks. "The present study shows for the first time that resveratrol improves insulin sensitivity, which might be due to a resveratrol-induced decrease in oxidative stress that leads to more efficient insulin signaling via the Akt pathway," the authors concluded. The Akt pathway is a pathway involved in cellular uptake of glucose in response to insulin—it induces glucose transport, particularly into muscle cells. When working properly, insulin stimulates cells to take in glucose from the blood stream, thereby lowering circulating glucose...

Strength training plus fasting regularly, and becoming diabetic!? No, it is just compensatory adaptation at work

Image
One common outcome of doing glycogen-depleting exercise (e.g., strength training, sprinting) in combination with intermittent fasting is an increase in growth hormone (GH) levels. See this post for a graph showing the acute effect on GH levels of glycogen-depleting exercise. This effect applies to both men and women, and is generally healthy, leading to improvements in mood and many health markers. It is a bit like GH therapy, with GH being “administered” to you by your own body. Both glycogen-depleting exercise and intermittent fasting increase GH levels; apparently they have an additive effect when done together. Still, a complaint that one sees a lot from people who have been doing glycogen-depleting exercise and intermittent fasting for a while is that their fasting blood glucose levels go up. This is particularly true for obese folks (after they lose body fat), as obesity tends to be associated with low GH levels, although it is not restricted to the obese. In fact, many people d...

Alcohol consumption, gender, and type 2 diabetes: Strange … but true

Image
Let me start this post with a warning about spirits (hard liquor). Taken on an empty stomach, they cause an acute suppression of liver glycogenesis. In other words, your liver becomes acutely insulin resistant for a while. How long? It depends on how much you drink; possibly as long as a few hours. So it is not a very good idea to consume them immediately before eating carbohydrate-rich foods, natural or not, or as part of sweet drinks. You may end up with near diabetic blood sugar levels, even if your liver is insulin sensitive under normal circumstances. The other day I was thinking about this, and the title of this article caught my attention: Alcohol Consumption and the Risk of Type 2 Diabetes Mellitus . This article is available here in full text. In it, Kao and colleagues show us a very interesting table (Table 4), relating alcohol consumption in men and women with incidence of type 2 diabetes. I charted the data from Model 3 in that table, and here is what I got: I used the dat...

How lean should one be?

Image
Loss of muscle mass is associated with aging. It is also associated with the metabolic syndrome, together with excessive body fat gain. It is safe to assume that having low muscle and high fat mass, at the same time, is undesirable. The extreme opposite of that, achievable though natural means, would be to have as much muscle as possible and as low body fat as possible. People who achieve that extreme often look a bit like “buff skeletons”. This post assumes that increasing muscle mass through strength training and proper nutrition is healthy. It looks into body fat levels, specifically how low body fat would have to be for health to be maximized. I am happy to acknowledge that quite often I am working on other things and then become interested in a topic that is brought up by Richard Nikoley , and discussed by his readers (I am one of them). This post is a good example of that. Obesity and the diseases of civilization Obesity is strongly associated with the diseases of civilization, o...