Posts

Showing posts with the label heart disease

How much alcohol is optimal? Maybe less than you think
Image
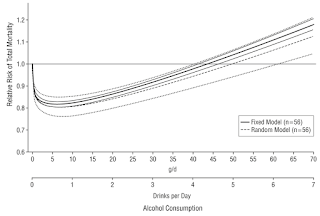
I have been regularly recommending to users of the software HCE ( ) to include a column in their health data reflecting their alcohol consumption. Why? Because I suspect that alcohol consumption is behind many of what we call the “diseases of affluence”. A while ago I recall watching an interview with a centenarian, a very lucid woman. When asked about her “secret” to live a long life, she said that she added a little bit of whiskey to her coffee every morning. It was something like a tablespoon of whiskey, or about 15 g, which amounted to approximately 6 g of ethanol every single day. Well, she might have been drinking very close to the optimal amount of alcohol per day for the average person, if the study reviewed in this post is correct. Studies of the effect of alcohol consumption on health generally show results in terms of averages within fixed ranges of consumption. For example, they will show average mortality risks for people consuming 1, 2, 3 etc. drinks per day. These studie...

The 2012 Atherosclerosis egg study: More smoking is associated with more plaque, unless you eat more eggs

Image
I blogged before about the study by David Spence and colleagues, published online in July 2012 in the journal Atherosclerosis ( ). This study attracted a lot of media attention (e.g., ). The article is titled: “Egg yolk consumption and carotid plaque”. The study argues that “regular consumption of egg yolk should be avoided by persons at risk of cardiovascular disease”. It hints at egg yolks being unhealthy in general, possibly even more so than cigarettes. I used the numbers in Table 2 of the article (only 5 rows of data, one per quintile; i.e., N=5) to conduct a type of analysis that is rarely if ever conducted in health studies – a moderating effects analysis. A previous blog post summarizes the results of one such analysis using WarpPLS ( ). It looked into the effect of the number of eggs consumed per week on the association between blood LDL cholesterol and plaque (carotid plaque). The conclusion, which is admittedly tentative due to the small sample (N=5), was that plaque decrea...

Does tallness cause heart disease? No, but sex does

Image
Popular beliefs about medical issues are sometimes motivated by a statistical phenomenon known as “spurious relationship”, among other names. Two variables X and Y are influenced by a third variable C, which leads to X and Y being correlated and thus the impression that X and Y are causally associated. Take a look at the table below, which I blogged about in a previous post ( ). This table shows that there is a strong unadjusted correlation between height and arterial stiffness, a marker of heart disease. The likelihood that the correlation is due to chance is lower than one tenth of a percentage point (P Interestingly, the authors of the study even use height as a control variable to narrow down the “true” causes of arterial stiffness (column with adjusted results), assuming that height did indeed influence arterial stiffness and what they found to be a key predictor of arterial stiffness, 2-hour postprandial glucose. But there is no convincing evidence that height causes heart dis...

Fasting blood glucose of 83 mg/dl and heart disease: Fact and fiction

Image
If you are interested in the connection between blood glucose control and heart disease, you have probably done your homework. This is a scary connection, and sometimes the information on the Internetz make people even more scared. You have probably seen something to this effect mentioned: Heart disease risk increases in a linear fashion as fasting blood glucose rises beyond 83 mg/dl . In fact, I have seen this many times, including on some very respectable blogs. I suspect it started with one blogger, and then got repeated over and over again by others; sometimes things become “true” through repetition. Frequently the reference cited is a study by Brunner and colleagues , published in Diabetes Care in 2006. I doubt very much the bloggers in question actually read this article. Sometimes a study by Coutinho and colleagues is also cited, but this latter study is actually a meta-analysis. So I decided to take a look at the Brunner and colleagues study. It covers, among other things, t...

Income, obesity, and heart disease in US states

Image
The figure below combines data on median income by state (bottom-left and top-right), as well as a plot of heart disease death rates against percentage of population with body mass index (BMI) greater than 30 percent. The data are recent, and have been provided by CNN.com and creativeclass.com, respectively. Heart disease deaths and obesity are strongly associated with each other, and both are inversely associated with median income. US states with lower median income tend to have generally higher rates of obesity and heart disease deaths. The reasons are probably many, complex, and closely interconnected. Low income is usually associated with high rates of stress, depression, smoking, alcoholism, and poor nutrition. Compounding the problem, these are normally associated with consumption of cheap, addictive, highly refined foods. Interestingly, this is primarily an urban phenomenon. If you were to use hunter-gatherers as your data sources, you would probably see the opposite relationsh...

Heavy physical activity may significantly reduce heart disease deaths, especially after age 45

Image
The idea that heavy physical activity is a main trigger of heart attacks is widespread. Often endurance running and cardio-type activities are singled out. Some people refer to this as “death by running”. Others think that strength training has a higher lethal potential. We know based on the Oregon Sudden Unexpected Death Study that this is a myth . Here is some evidence that heavy physical activity in fact has a significant protective effect. The graph below, from Brooks et al. (2005) shows the number of deaths from coronary heart disease, organized by age group, in longshoremen (dock workers). The shaded bars represent those whose level of activity at work was considered heavy. The unshaded bars represent those whose level of activity at work was considered moderate or light (essentially below the “heavy” level). The data is based on an old and classic study of 6351 men, aged 35 to 74 years, who were followed either for 22 years, or to death, or to the age of 75. It shows a signific...

Long distance running causes heart disease, unless it doesn’t

Image
Regardless of type of exercise, disease markers are generally associated with intensity of exertion over time. This association follows a J-curve pattern. Do too little of it, and you have more disease; do too much, and incidence of disease goes up. There is always an optimal point, for each type of exercise and marker. A J curve is actually a U curve, with a shortened left end. The reason for the shortened left end is that, when measurements are taken, usually more measures fall on the right side of the curve than on the left. The figure below (click to enlarge) shows a schematic representation that illustrates this type of relationship. (I am not very good at drawing.) Different individuals have different curves. If the vertical axis was a measure of health, as opposed to disease, then the curve would have the shape of an inverted J. The idea that long distance running causes heart disease has been around for a while. Is it correct? If it is, then one would expect to see certain thin...