Posts

Showing posts from July, 2012

The 14-percent advantage of eating little and then a lot: Putting it in practice

Image
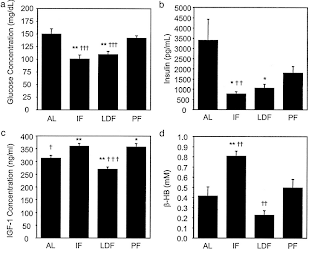
In my previous post I argued that the human body may react to “eating big” as it would to overfeeding, increasing energy expenditure by a certain amount. That increase seems to lead to a reduction in the caloric value of the meals during overfeeding; a reduction that seems to gravitate around 14 percent of the overfed amount. And what is the overfed amount? Let us assume that your daily calorie intake to maintain your current body weight is 2,000 calories. However, one day you consume 1,000 calories, and the next 3,000 – adding up to 4,000 calories in 2 days. This amounts to 2,000 calories per day on average, the weight maintenance amount; but the extra 1,000 on the second day is perceived by your body as overfeeding. So 140 calories are “lost” . The mechanisms by which this could happen are not entirely clear. Some studies contain clues; one example is the 2002 study conducted with mice by Anson and colleagues ( ), from which the graphs below were taken. In the graphs above AL refers

The 14-percent advantage of eating little and then a lot: Is it real?

Image
When you look at the literature on overfeeding, you see a number over and over again – 14 percent. That is approximately the increase in energy expenditure you get when you overfeed people; that is, when you feed people more calories that they need to maintain their current weight. This phenomenon is related to another interesting one: the nonlinear increase in body weight and fat mass following overfeeding after a period starvation, illustrated by the top graph below from an article by Kevin Hall ( ). The data for the squares on the top graph is from the Minnesota Starvation Experiment ( ). The graph at the bottom is based mostly on the results of a simulation, and doesn’t clearly reflect the phenomenon. Due to the significant amount of weight lost in what is called above the semistarvation stage (SS), the controlled refeeding period (CR) actually involved significant overfeeding. Nevertheless, weight was not gained right away, due to a sharp increase in energy expenditure. That is

Sievenpiper: Fructose should not "worry" in diabetes

As the fructose debate rages on, one serious concern has been what the message should be for people who have diabetes. There's no question that the alarming media headlines, articles, and YouTube videos have confused many with prediabetes and both type 1 and type 2 diabetes. Even health professionals and organizations like the American Diabetes Association have taken a cautious approach by recommending avoidance of fructose as a sweetening agent. That is, for fear it may raise plasma lipids. They stop short of recommending people avoid fructose from fruit. There is also the extreme arguments of Internet marketers like Joe Mercola blasting out articles about the supposed danger of fructose including that of which comes from fruit. (I've had more questions than I can count about Mercola's unreasonably scary headlines and viral copy. He makes baseless recommendations that those with diabetes should cut fructose from all sources to amounts of less than 15g per day.) In my prio

The lowest-mortality BMI: What is the role of nutrient intake from food?

Image
In a previous post ( ), I discussed the frequently reported lowest-mortality body mass index (BMI), which is about 26. The empirical results reviewed in that post suggest that fat-free mass plays an important role in that context. Keep in mind that this "BMI=26 phenomenon" is often reported in studies of populations from developed countries, which are likely to be relatively sedentary. This is important for the point made in this post. A lowest-mortality BMI of 26 is somehow at odds with the fact that many healthy and/or long-living populations have much lower BMIs. You can clearly see this in the distribution of BMIs among males in Kitava and Sweden shown in the graph below, from a study by Lindeberg and colleagues ( ). This distribution is shifted in such a way that would suggest a much lower BMI of lowest-mortality among the Kitavans, assuming a U-curve shape similar to that observed in studies of populations from developed countries ( ). Another relevant example come